Data Platform Strategy
Big Data Analytics in Retail: The Five Use Cases That Pay Back, and What Each One Needs First
Big data analytics in retail pays back in five places. What each use case needs, where it stops paying off, and the platform UK retailers build first.
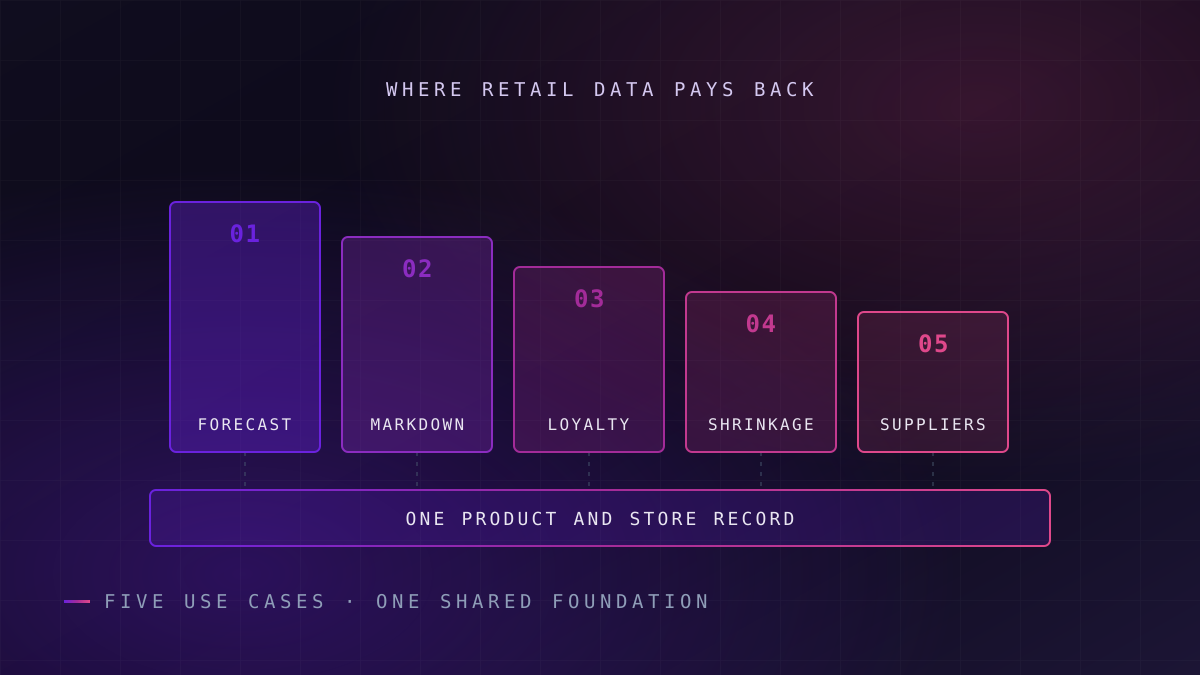
Big data analytics in retail is the use of transaction, stock, customer and supplier data at full grain to make operational decisions, not just to report on them. Five use cases reliably repay the platform cost: demand forecasting, pricing and markdown, loyalty personalisation, shrinkage analytics and supplier performance. Each fails without one shared, trusted product and store record underneath.
The pressure on UK retail data has changed shape. The Office for National Statistics reported that 28.8% of Great Britain's retail sales were made online in August 2026, up from 28.4% the month before. A retailer that sells across stores, its own site and marketplaces now holds the same customer, the same product and the same stock unit in three or four systems that rarely agree.
Loss has moved too. The British Retail Consortium's Crime Report, published in February 2026, counted 5.5 million detected shoplifting incidents in the previous year, and warned that many more go undetected. A loss that is not detected is, by definition, a data problem before it is a security one.
Key idea
Most retailers already hold the data
Till transactions, stock movements, loyalty records and supplier deliveries are already captured. What is usually missing is one agreed record of product, store and customer that every use case can trust.
What follows is a practical account of the five use cases that pay back, the data each one needs, where each stops paying off, and the platform that has to exist before any of them can be relied on.
What Big Data Analytics in Retail Actually Means
The phrase is used loosely, often to describe any dashboard built on sales data. That usage hides the part that costs money and creates value.
Retail reporting answers questions about the past at an aggregated level: sales by category by week. Big data analytics works at the grain the business actually operates at: each basket, each stock movement, each store-day, each loyalty interaction. It uses that grain to drive a decision, such as how many units to send to a store tomorrow or when to start a markdown.
Three properties separate the two. The data is held at full grain rather than pre-summarised. It joins sources that were built separately, such as the till, the warehouse system and the loyalty platform. And the output feeds an operational process with an owner, rather than a slide.
What this means for you: if your analytics only ever produces reports, you have a reporting estate, and the case for a bigger platform has not yet been made.
The Five Use Cases at a Glance
Each use case below draws on largely the same data. The final column is the one to read first, because it tells you which use case your current data can carry.
| Use case | Data it needs | Decision speed | Who owns the number | Choose this first when |
|---|---|---|---|---|
| Demand forecasting and replenishment | Sales at store-SKU-day, stock on hand, promotions calendar | Daily | Supply chain | Store availability gaps are a known board issue |
| Pricing and markdown | Sales history, stock age, competitor prices, margin by line | Weekly, daily at end of season | Commercial | Clearance stock is written off or sold through too late |
| Loyalty personalisation | Basket history linked to a customer ID, consented contact data | Daily to real time | Marketing and CRM | Loyalty data is collected but not used beyond vouchers |
| Shrinkage analytics | Stock adjustments, till voids and refunds, store events | Daily | Loss prevention | Unknown loss is a material line in the P&L |
| Supplier performance | Purchase orders, deliveries, quality returns, lead times | Weekly | Buying and merchandising | Supplier disputes are argued from different numbers |
The use cases share most of their inputs. A retailer that builds clean store-SKU-day sales and stock data for forecasting has already built most of what markdown and shrinkage analytics need.
Demand Forecasting and Store Replenishment
What this means for you: forecasting is the use case most likely to pay back first, and the one most often undermined by bad stock data rather than a weak model.
A forecast estimates how many units of each product each store will sell on each day. Replenishment turns that estimate into an order. The value sits in fewer empty shelves and less excess stock, both of which show up directly in sales and working capital.
What it needs before a model is worth building
The model is rarely the constraint. The constraints are a clean sales history at store-SKU-day grain, stock-on-hand figures that match what is physically on the shelf, and a promotions calendar that records what actually ran, not what was planned.
Stock accuracy decides the outcome. If the system believes a store holds twelve units and the shelf holds none, the forecast is irrelevant: no replenishment order is raised, and the sales history then records zero demand for an item that was simply missing.
Failure mode
Lost sales look like low demand
When a product is out of stock, the sales history records zero. A model trained on that history learns to forecast less of the product that ran out, and the gap widens every cycle until stock data is corrected.
Where it stops paying off
Long-tail lines that sell a few units a month in each store rarely justify a sophisticated model; a simple rule often performs as well. The same is true of products whose demand is driven almost entirely by a single promotion. Spend the modelling effort on the high-volume, perishable and seasonal lines, where small errors cost the most, and segment lines this way before commissioning a machine learning forecasting model.
Pricing, Promotions and Markdown
What this means for you: markdown analytics pays back fastest in categories with a hard end of season, where every week of delay lowers the price that clears the stock.
Pricing analytics estimates how sales respond to price changes for each product, and uses that response to set regular prices, promotional prices and clearance markdowns. The highest-value decision is usually the markdown: when to start it, how deep to go, and in which stores.
The data it needs is the forecasting data plus stock age, margin by line and, where it can be gathered lawfully, competitor prices. The difficulty is that promotions distort the history. A product that sold well at a third off tells you little about its demand at full price unless the promotion is recorded accurately against every affected transaction.
A markdown started one week late is paid for in margin on every unit that follows.
Personalised pricing is a separate matter. Offering different prices to different customers on the basis of their data raises questions of fairness and consumer law that go beyond analytics, and it belongs with legal and commercial leadership before it reaches a data team.
Loyalty and Personalisation Under UK GDPR
What this means for you: loyalty data is the richest dataset most retailers own, and the one with the most legal conditions attached to how it can be used.
A loyalty programme links baskets to a person over time. That link supports personalised offers, better range decisions for each store's actual customers, and an early signal when a regular customer starts to lapse. Lapse detection is a sensible first analytics use of loyalty data, because it needs only basket history and produces a list someone can act on that week.
The legal framework changed in 2026. The Data (Use and Access) Act 2025 inserted Articles 22A to 22D into UK GDPR, which took effect on 5 February 2026 and set the conditions for decisions made solely by automated means. They matter where an automated decision has a legal or similarly significant effect on a person. Most offer targeting will not meet that bar; decisions about account access, credit or individually set prices can.
Readiness signal
Test before you personalise
For each automated decision that uses loyalty data, write down who is affected, what changes for them, and whether a person can ask for it to be reviewed. If any answer is unclear, resolve it before the model goes live.
The practical consequence is design, not delay. Record the lawful basis and the consent state alongside each customer record, so every downstream use can check it, and keep a log of which model made which decision.
Shrinkage and Supplier Performance
What this means for you: these two use cases are often run as separate projects, but both depend on reconciling what the systems say happened with what physically happened.
Shrinkage analytics
Shrinkage is the gap between recorded stock and actual stock. It combines theft, damage, administrative error and supplier short delivery. Analytics cannot see a theft, but it can see the patterns around loss: unusual voids and refunds at particular tills, stock adjustments that cluster on certain lines, and stores whose loss rises out of step with their sales.
The value is in prioritisation. Loss prevention teams have limited people, and analytics directs their attention to the stores, lines and times where loss concentrates. The most useful output is often not a fraud score but a corrected stock figure, which then improves forecasting as well.
Supplier performance
Supplier analytics compares what was ordered with what arrived: on time, in full, and to specification. It turns supplier conversations from argument into evidence, and it feeds back into forecasting through more accurate lead times.
The most valuable output of shrinkage analytics is often a corrected stock figure, not a fraud score.
This use case needs purchase orders, goods-received records and quality returns joined at the line level. In many estates those live in three systems with three different product codes, which is why supplier analytics usually waits on a single product record.
The Platform Underneath: What Has to Exist First
What this means for you: all five use cases draw on the same few foundations, so the platform decision is made once, not five times.
One product and store record
A single agreed list of products, stores and their attributes, used by every system and every use case. Without it, each team reconciles codes by hand.
Full-grain history in a lakehouse
Sales, stock and loyalty data held at transaction level in an open format, so forecasting and pricing can both read it without separate extracts.
Fresh data where speed matters
Change data capture or event streaming for stock and online orders, so availability and online decisions are not working from last night's position.
Agreed definitions and quality checks
One definition of sales, margin and availability, published through a semantic layer, with automated checks that stop bad data before a decision uses it.
A data lakehouse holds raw and modelled data together, so the same store-SKU-day history serves forecasting, pricing and shrinkage without three copies. Change data capture keeps stock positions current without rebuilding them overnight; our account of real-time data streaming covers when that latency is worth paying for.
A semantic layer matters more in retail than most sectors, because "sales" can mean gross or net, with or without returns, with or without marketplace orders. If buying and finance use different definitions, every use case inherits the argument. Automated data quality checks, of the kind described in our piece on data observability and quality management, catch a broken feed before a replenishment run uses it.
Whoever does the data platform engineering, the order holds: the shared record first, then full-grain history, then the use case that the business has chosen to fund.
When Big Data Analytics Is the Wrong Investment
A large analytics platform is the wrong first step in three situations.
The first is a retailer without a reliable product and store record. If the same product carries different codes in the till, the warehouse and the website, a platform built on top inherits the confusion at greater scale and cost. Fix the record first; it is cheaper and it pays back on its own.
The second is a business with low volume or a narrow range. A specialist retailer with a few hundred lines and a handful of stores can often forecast and price well with a well-kept spreadsheet and a disciplined buying team. The platform cost will exceed the error it removes.
In practice
The unglamorous fix pays first
Agreeing one set of product and store codes across the till, the warehouse system and the website is rarely funded as a project. It is also the step that makes every later use case cheaper to build.
The third is a programme with no decision owner. Analytics that produces a recommendation nobody is accountable for acting on will be ignored, however accurate it is. If no one in supply chain, commercial or loss prevention will change how they work because of the output, do not build it yet.
Where to Start on Monday
The sequence matters more than the technology. A first production use case, scoped to one category and one region, typically moves in weeks rather than quarters; extending it across the estate is the multi-quarter work.
- Choose one use case with an owner. Use the table above and pick the one where a named person will act on the output. For most retailers this is forecasting or markdown.
- Audit the data it needs. Check sales grain, stock accuracy and product codes for that use case only. A scoped data strategy assessment can cover this step.
- Fix the shared record for that scope. Agree product and store codes for the chosen category, and publish them as the source every system reads.
- Build the first use case end to end. From data to a decision someone acts on, with the result measured against what happened before.
- Add automated quality checks. Put tests on the inputs before extending the use case, so growth does not multiply errors. An accelerator such as DQ Sentinel automates the validation and anomaly detection.
- Extend to the next use case. Reuse the record and the history. The second use case should cost noticeably less than the first; if it does not, revisit the foundations.
Where a consumer goods supplier shares the work, our CPG intelligence accelerator covers forecasting and promotion analytics from the supplier side.
Frequently Asked Questions
What is big data analytics in retail?
Big data analytics in retail is the use of detailed transaction, stock, customer and supplier data to make operational decisions, such as how much stock to send to each store or when to start a markdown. It differs from reporting because it works at the level of individual baskets and stock movements, joins data from separate systems, and feeds a decision that a named team acts on.
Which retail analytics use case pays back first?
Demand forecasting and replenishment usually pays back first, because better forecasts reduce both empty shelves and excess stock, which show up directly in sales and working capital. Markdown optimisation is often a close second in categories with a fixed end of season. The right first choice is the use case where a named owner will act on the output and the underlying stock data is accurate.
What are examples of big data in retail?
Common examples are store-level demand forecasting, markdown timing for seasonal stock, personalised offers based on loyalty card baskets, detecting unusual refund and void patterns that point to loss, and measuring supplier deliveries against orders. Each combines data from more than one system, such as tills, warehouse stock records and loyalty platforms, at the level of individual transactions.
Does UK GDPR restrict retail personalisation?
UK GDPR applies to any use of loyalty and customer data, and requires a lawful basis and clear information for customers. Articles 22A to 22D, in force since 5 February 2026, set conditions for decisions made solely by automated means that have a legal or similarly significant effect. Most offer targeting falls below that threshold, but automated decisions on credit, account access or individual pricing may not.
Do small retailers need a big data platform?
Many do not. A retailer with a narrow range and a few stores can often forecast and price effectively with simpler tools and a disciplined buying team. A larger platform becomes worthwhile when the number of products, stores and channels makes manual decisions slow or inconsistent, and when a named team is ready to change how it works based on the output.
Unolabs is a Data and AI first engineering consultancy, headquartered in the United Kingdom with engineering operations in Pune and active engagements across the UK, Australia, and Hong Kong. We help enterprises build the architectural foundation for autonomous AI execution — governed data platforms, semantic intelligence, and agentic systems that enterprises can stand behind.
If you are weighing which retail analytics use case to fund first, book a discovery call and we will work through it with you.
More Where
This Came From.
New architectural deep-dives land every two weeks. Pick your channels and we will send them as they publish.
Continue reading
- Data Platform StrategyMicrosoft Fabric vs Databricks: An Architect's Decision FrameworkA vendor-neutral framework for Microsoft Fabric vs Databricks: capacity and DBU economics, Purview and Unity Catalog, interop, and when to run both.15 min read
- AI Readiness & StrategyThe Agent Tax: Why Replacing Your RPA Bots with AI Agents Could Blow Up Your Automation BudgetSwapping RPA bots for AI agents turns a fixed automation cost into one that scales with volume. The four cost lines most business cases leave out.14 min read
- Agentic ArchitecturesDesigning Production Agentic AI Systems: Architecture Patterns, Guardrails, and EvaluationHow production agentic AI is built: the agent loop, typed tool contracts, guardrail config, evaluation harnesses, and the gates that grant autonomy safely.15 min read
Find out which retail use case your data can carry
We will check your sales, stock and loyalty data against the five use cases above and tell you which one your platform can support today, and what blocks the rest.
Book a Retail Data Review