Data Infrastructure
Smart Meter Data Platforms: What UK Utilities Need for Half-Hourly Data
The data platform behind UK smart meter half-hourly data: MHHS timelines, volumes, data quality, consent rules, use cases and a reference architecture.
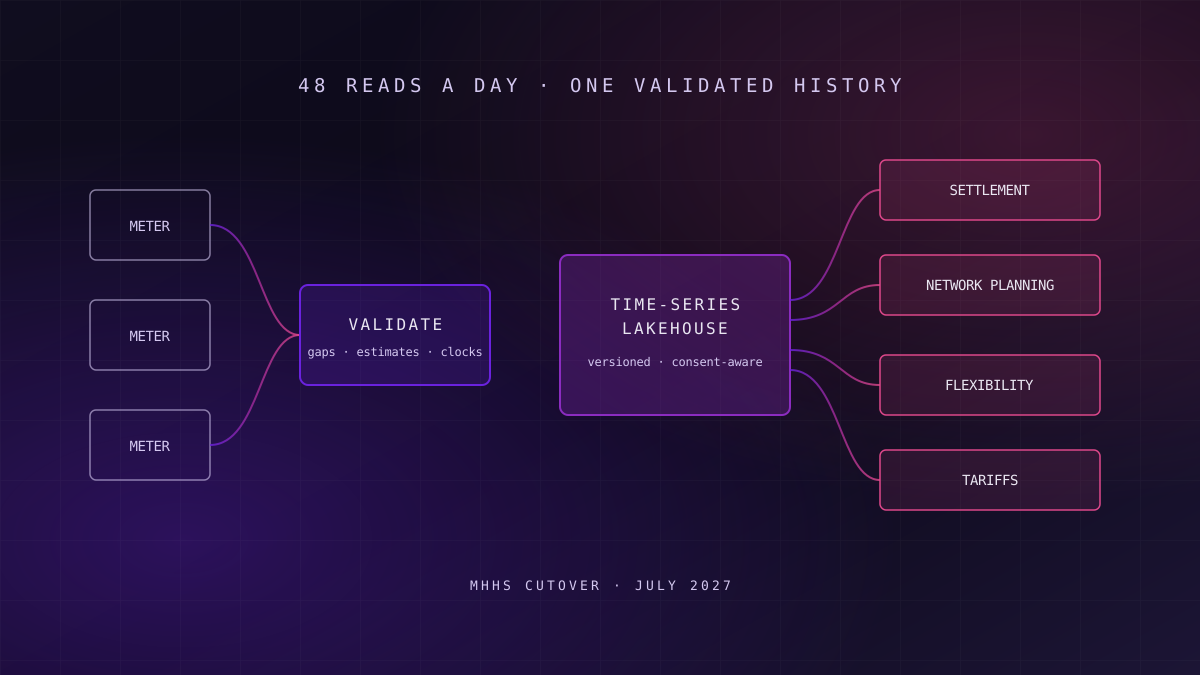
A smart meter data platform ingests half-hourly reads, validates and repairs them, records the consent each read carries, and serves settlement, network planning, flexibility and tariff analytics from one governed store. Market-wide Half-Hourly Settlement, due to cut over in July 2027, turns interval data from an analytics asset into a regulated settlement input.
Most utilities already hold years of smart meter data. Far fewer hold it in a form that can be trusted for settlement, explained to a regulator and reused by network and commercial teams without each building its own copy. That gap is the subject of this article.
Why Half-Hourly Data Became a Platform Problem
What this means for you: interval data used to be an optional analytics feed; MHHS makes it the basis of how energy is settled, so its quality now has a direct financial consequence.
Great Britain had 41 million smart and advanced meters in homes and small businesses at the end of 2025, about 71% of all meters, according to the Department for Energy Security and Net Zero's Q4 2025 statistics. Around 27 million of those were SMETS2 meters, the second-generation design that communicates through the Data Communications Company (DCC), the licensed body that runs the national smart metering network.
Market-wide Half-Hourly Settlement (MHHS) is the industry programme, run by Elexon under Ofgem's direction, that moves every meter in Great Britain onto settlement using actual half-hourly consumption rather than estimated profiles. According to the MHHS Programme's published milestones, migration completes at milestone M15 in May 2027, and the cutover to the new settlement timetable, milestone M16, is scheduled for 2 July 2027.
Under MHHS, a missing half-hour is no longer a gap in a chart. It is an estimate in someone's settlement position.
The settlement timetable also shortens. Elexon describes the move from a 14-month settlement timetable to a four-month one at M16. Errors that once had more than a year to be found and corrected now have a third of that time, which shifts the burden onto data quality controls that run every day rather than reconciliations that run every quarter.
What a Smart Meter Data Platform Actually Is
What this means for you: if your interval data lives in a billing system, a network planning extract and a data science sandbox, you have three copies and no platform.
A smart meter data platform is the governed layer between the meter communications network and every consumer of interval data. It receives reads, validates them against expected patterns, estimates and flags where reads are missing, applies consent and privacy rules, and publishes curated, versioned datasets to downstream systems. The platform is not the meter data management system that a supplier or agent may run for operational purposes; it is the analytical and reporting estate built around that system.
The distinction matters because the two have different jobs. Operational systems need to process today's reads on time. The platform needs to hold years of history, reconcile versions as reads are corrected, and answer questions nobody anticipated when the data arrived. Treating one as the other produces either an operational system overloaded with analytical queries, or an analytics store that nobody trusts for regulated reporting.
| Layer | What it holds | Who depends on it | Failure if missing |
|---|---|---|---|
| Ingestion | Raw reads as received, with arrival time | Every downstream consumer | No audit trail of what arrived when |
| Validation and estimation | Checked reads, gaps flagged, estimates marked | Settlement and billing | Estimates silently treated as actuals |
| Consent and privacy | The data granularity each customer has agreed to | Every use case touching domestic data | Use of data a customer has not consented to |
| Curated time series | Versioned, corrected interval history | Analytics, network planning, flexibility | Every team rebuilds its own copy |
| Serving | Aggregates, features and extracts | Tariff design, forecasting, regulators | Slow, inconsistent answers to the same question |
Volumes, Time Series and the Cost of Getting Storage Wrong
What this means for you: interval data is large but predictable, and the expensive mistakes come from storage layout rather than from raw volume.
A half-hourly meter produces 48 reads a day, or 17,520 a year, before any re-reads, corrections or register data. Multiplied across a supplier or network operator's portfolio, that becomes billions of rows a year, each one small. The pattern is narrow, append-heavy and time-ordered, and almost every query filters on time and on a meter or a group of meters.
That shape suits columnar storage in a data lakehouse, partitioned by date and clustered by meter or by network area, with an open table format that supports versioned updates as reads are corrected. A general-purpose relational database can hold the same data, but it tends to struggle once analysts start running year-on-year comparisons across millions of meters.
Failure mode
Failure mode: partitioning by meter
Partitioning interval data by meter identifier produces millions of tiny partitions, slow queries and a large metadata bill. Partition by date and cluster by meter or area instead.
The detail of file sizing, clustering and compaction on large tables is in our guide to lakehouse performance tuning. The commercial side, keeping compute and storage costs attributable as volumes grow, is covered in the playbook for data platform cost control.
Corrections are where storage design is tested. Reads arrive late, are re-read, or are replaced by validated values. The platform has to keep each version, know which one settlement used, and still give analysts a simple "current best value" view. An open table format with time travel makes this practical; a design that overwrites in place makes it impossible to explain a historical settlement figure later.
Data Quality: Gaps, Estimates and Clocks
What this means for you: the quality rules for interval data are specific and well understood, so there is little excuse for discovering them in production.
Gaps and Late Arrivals
Communication failures, firmware issues and network outages leave gaps. Some reads arrive hours or days late. The platform must distinguish a read that is missing from one that has not arrived yet, and it must never let a later analytical job treat a gap as zero consumption.
Estimates Versus Actuals
Where a read is missing, settlement and billing processes estimate it. Every estimated value must carry a flag that survives every downstream transformation. When estimates and actuals are mixed without a flag, forecasting models learn from invented data and network planners size assets on smoothed demand.
Readiness signal
Readiness signal: can you count your estimates?
Ask what share of yesterday's half-hourly reads were estimated, by region and meter type. If the answer takes more than a query, your estimates are not flagged in a way your analytics can see.
Clocks, Time Zones and the Two Awkward Days
Interval data is only as good as its timestamps. Meter clock drift shifts consumption into the wrong half-hour. The change to and from British Summer Time produces days with 46 and 50 half-hourly periods, which break any pipeline that assumes 48. Store timestamps in UTC, convert only at the presentation layer, and test both clock-change days explicitly in CI.
Defining these checks as explicit data quality SLOs, with an owner and a threshold, turns them from tribal knowledge into controls. The wider practice of monitoring freshness, completeness and drift is set out in our guide to data observability and quality management.
Consent and Privacy Are Part of the Data Model
What this means for you: consent determines which granularity of data each use case may touch, so it belongs in the platform's data model, not in a policy document.
Domestic half-hourly consumption data can reveal a great deal about how a household lives, and the rules on accessing it have been tightened and revised over the past decade. Under Ofgem's original Data Access and Privacy Framework, suppliers needed a domestic customer's opt-in consent to access half-hourly data, could access daily data unless the customer opted out, and could use monthly data for billing and licence obligations.
MHHS changed this for settlement. Ofgem's 2022 decision modifying standard licence condition 47 of the electricity supply licence set a framework in which domestic consumers on the new arrangements provide half-hourly data by default, with the right to opt out to daily processing. Ofgem's decision also stated that customers already on smart meters before the framework changed keep their existing rights until they switch contract or supplier.
Consent is a column, not a clause. If the platform cannot filter on it, the policy cannot be enforced.
In practice this means each meter carries a consent state with an effective date, and each use case declares the granularity it needs and the legal basis it relies on. A tariff analytics team may need half-hourly data under one basis while network planning works on aggregated data under another. The platform enforces this through views and access policies, and it logs which datasets each use case read, so that the answer to a data protection request is a query rather than an investigation.
The Use Cases, and What Each One Needs
What this means for you: settlement is the regulated driver, but the business case for a shared platform comes from the other teams reusing the same governed data.
Settlement
Validated half-hourly consumption, estimates flagged, versions retained, delivered to the settlement timetable. The least tolerant of quality failures.
Network planning
Aggregated demand by feeder or substation, with peak and diversity analysis. Needs history and good spatial reference data more than freshness.
Flexibility
Near-real-time view of demand and response to dispatch events, measured against a baseline. Needs low latency and a defensible baseline method.
Tariffs and forecasting
Load profiles by customer segment and time of use, used to design tariffs and forecast demand. Needs consent-aware access and clean features.
Each use case wants something different from the same reads. Settlement needs completeness and auditability. Network planning needs long, consistent history and a reliable link between meters and the network topology. Flexibility services need fresh data and an agreed baseline for measuring what changed. Tariff and forecasting teams need consent-aware features they can train models on, which is where predictive machine learning and the platform meet.
Where latency matters, interval data and dispatch events usually arrive as streams. The patterns for landing streaming data reliably in a lakehouse are covered in our guide to Kafka-to-lakehouse streaming patterns. Where operational systems hold the reference data, such as customer, tariff and network connectivity, capturing their changes rather than reloading them nightly is the job of change data capture.
A Reference Architecture That Holds Up
What this means for you: the architecture is not novel; the discipline is in keeping one validated history that every team uses.
A workable architecture has five stages. Reads and events land unchanged in a raw zone with their arrival time. A validation stage checks completeness, ranges, clocks and duplicates, and flags or estimates as required. A curated zone holds versioned interval history, joined to meter, customer, consent and network reference data. A serving layer publishes aggregates, features and extracts for each use case. Governance spans all of it: lineage, access policies, quality SLOs and retention.
Key idea
One validated history, many consumers
The test of the architecture is whether settlement, network planning and tariff analytics all read the same validated, versioned interval data. If each one validates its own copy, the numbers will diverge and nobody will be able to say which is right.
Industry data models shorten the design work considerably, because meter, supply point, network and consent entities are well understood. Our utility industry data templates start from that model rather than from a blank page. The platform build itself, including landing zones, table formats and cost controls, is a data platform engineering exercise, and the ingestion of high-volume interval and event feeds is real-time streaming engineering.
Data lineage is the part most often deferred and most often regretted. When a settlement figure is challenged, the organisation needs to show which reads, which estimates and which version of the validation rules produced it.
When a Simpler Approach Is Enough
What this means for you: not every organisation that touches interval data needs a dedicated platform, and building one too early wastes money.
A dedicated platform is the wrong investment where interval data has a single consumer and that consumer's system already validates and stores it adequately. A small supplier whose settlement agent handles validation, and whose only other use is a monthly demand report, may be better served by a well-governed extract and a modest analytical database than by a lakehouse and streaming estate.
It is also premature where the organisation has not yet decided what it will use the data for beyond compliance. Building ingestion for every possible feed before any team has committed to a use case produces cost without value. The better sequence is to deliver settlement-grade validation first, then add network, flexibility or tariff use cases one at a time, each with a named owner and a measurable outcome.
In practice
In practice: start from the hardest consumer
Settlement is the least forgiving consumer of interval data. A pipeline built to its standards of completeness, flagging and versioning will usually satisfy the analytical teams too; the reverse is rarely true.
The judgement is the same one set out in our discussion of when industry templates pay off and when they cost you: a head start helps when the model fits the business, and becomes a burden when it is adopted for its own sake.
Where to Start Before M16
What this means for you: with cutover scheduled for July 2027, the useful work now is proving the data path end to end, not adding new features.
Start by tracing one day of interval data from meter to every consumer. Record where it lands, where it is validated, where estimates are made, where consent is applied and where copies are made. Most organisations find at least one undocumented copy and at least one place where estimates lose their flag.
Next, make the quality rules explicit: completeness by region and meter type, late-arrival windows, clock-change handling and estimate ratios, each with an owner and a threshold. Then put consent state into the data model with effective dates, and route every use case through views that enforce it.
Finally, consolidate. Pick the curated interval history that settlement will rely on, and move network planning and tariff analytics onto it, retiring their private copies. Scope matters here: proving the data path for one region or one meter population can move in weeks, while consolidating every consumer across the estate is a multi-quarter programme that should be sequenced against the MHHS milestones rather than run in parallel with cutover.
Frequently Asked Questions
What is Market-wide Half-Hourly Settlement?
Market-wide Half-Hourly Settlement is the industry programme, run by Elexon under Ofgem's direction, that moves every electricity meter in Great Britain onto settlement using actual half-hourly consumption instead of estimated profiles. According to the MHHS Programme's milestones, migration completes in May 2027 and cutover to the new four-month settlement timetable is scheduled for 2 July 2027.
How much data does a half-hourly smart meter produce?
A half-hourly meter produces 48 consumption reads a day, or 17,520 a year, before corrections, re-reads and register data are added. Across a portfolio of millions of meters this becomes billions of small, time-ordered rows each year, which suits columnar lakehouse storage partitioned by date and clustered by meter or network area rather than a general-purpose transactional database.
Do customers have to consent to half-hourly data use?
It depends on the purpose and when the customer joined. Ofgem's 2022 licence decision set half-hourly data as the default for settlement under the new arrangements, with domestic customers able to opt out to daily processing. Other uses, and customers on smart meters before the change, follow the earlier consent rules, so a platform needs consent state recorded per meter with effective dates.
What data quality problems affect smart meter data?
The common problems are missing reads from communication failures, late-arriving reads, estimated values that lose their flag, duplicate reads, meter clock drift, and the clock-change days with 46 or 50 half-hourly periods instead of 48. Each needs an explicit rule, an owner and a threshold, tested daily, because under a shorter settlement timetable there is less time to find and correct errors.
Does every utility need a dedicated smart meter data platform?
No. A dedicated platform pays off when several teams, such as settlement, network planning, flexibility and tariff design, need the same validated interval history. Where interval data has a single consumer whose system already validates and stores it well, a governed extract and a modest analytical database are often enough until a second use case is committed.
Unolabs is a Data and AI first engineering consultancy, headquartered in the United Kingdom with engineering operations in Pune and active engagements across the UK, Australia, and Hong Kong. We help enterprises build the architectural foundation for autonomous AI execution — governed data platforms, semantic intelligence, and agentic systems that enterprises can stand behind.
If you are weighing how to prepare your smart meter data platform for half-hourly settlement, book a discovery call and we will work through it with you.
More Where
This Came From.
New architectural deep-dives land every two weeks. Pick your channels and we will send them as they publish.
Continue reading
- Data InfrastructureData Mesh vs. Fabric: Selecting the Right Architecture for 2026Data mesh versus data fabric across ten dimensions: what each one fixes, how each one fails, and a decision framework for choosing or combining them.15 min read
- Data InfrastructureLakehouse Performance Tuning: Optimising Multi-Petabyte Databricks EnvironmentsBeyond Z-Order and Liquid Clustering: how to tune a multi-petabyte Databricks lakehouse in the order that pays — layout, then skipping, then compute.15 min read
- Data InfrastructureKafka-to-Lakehouse Streaming Patterns for Global ScaleImplementation patterns for Kafka-to-lakehouse pipelines: exactly-once ingestion, schema evolution, stream processing, and millisecond serving.14 min read
Test your half-hourly data platform before M16
We will trace one day of interval reads from meter to settlement and analytics, and show you where gaps, estimates, consent rules and cost will break first.
Book a Meter Data Review