Utility
Unolabs builds the grid intelligence platforms required for the energy-AI nexus. We integrate SCADA, AMI, and GIS signals into a real-time balancing layer that allows utilities to treat AI data centres as dynamic grid partners.
For energy retail, power distribution, water utilities, and regulated grid operations.
Engineering specialised data zones and autonomous processing layers for Utility leaders.
Analytics stops at the NERC-CIP boundary
Every useful signal lives inside the electronic security perimeter, and every analytics platform lives outside it — so the AMI interval data that could sharpen SAIDI and SAIFI reporting sits in a historian nobody can safely query. Meanwhile, large flexible loads are stacking up in the interconnection queue while load forecasts still run on last decade's assumptions. We build one-way, CIP-respecting data paths that get OT signals to planning without widening the perimeter — a discipline we apply across electric, water, and wastewater utilities alike, where WIMS and treatment-works telemetry feed CSO event-duration and DMA leakage reporting under the same boundary constraints.
Architectural Bottlenecks Hindering Utility Transformation
Grid Asset Fragmentation: SCADA telemetry, AMI interval reads, and GIS connectivity are duplicated across SAP and operational systems on both sides of the IT/OT boundary, so the as-built network, the as-operated network, and the asset ledger never agree — and no real-time view of grid health exists.
Regulatory & Operational Friction: SAIDI/SAIFI/CAIDI reporting, outage analytics, and rate-case evidence require trusted lineage from field device to filed number, plus consistent master data across OMS, MDM, and billing — provenance legacy estates cannot produce without manual assembly.
Energy-AI Nexus Volatility: Interconnection queues are filling with hyperscale data centres and other large flexible loads, while forecasting models built for passive demand cannot see queue signals, DER growth, or load flexibility — leaving utilities without the real-time intelligence to treat these consumers as dynamic demand-response partners.
Relevant patterns from industry work
Each pattern represents a validated technical outcome delivered for global enterprise clients.
Data Centre Grid Balancing
Implemented a real-time load-balancing layer for a major utility, allowing them to treat AI data centres as grid partners for demand-response and peak-shaving amid rapidly growing AI data-centre load.
Predictive Vegetation Management
Used 3D geospatial modelling and AI to predict vegetation-related grid risks, reducing vegetation-related outages through targeted maintenance scheduling.
Energy Retail Master Data Platform
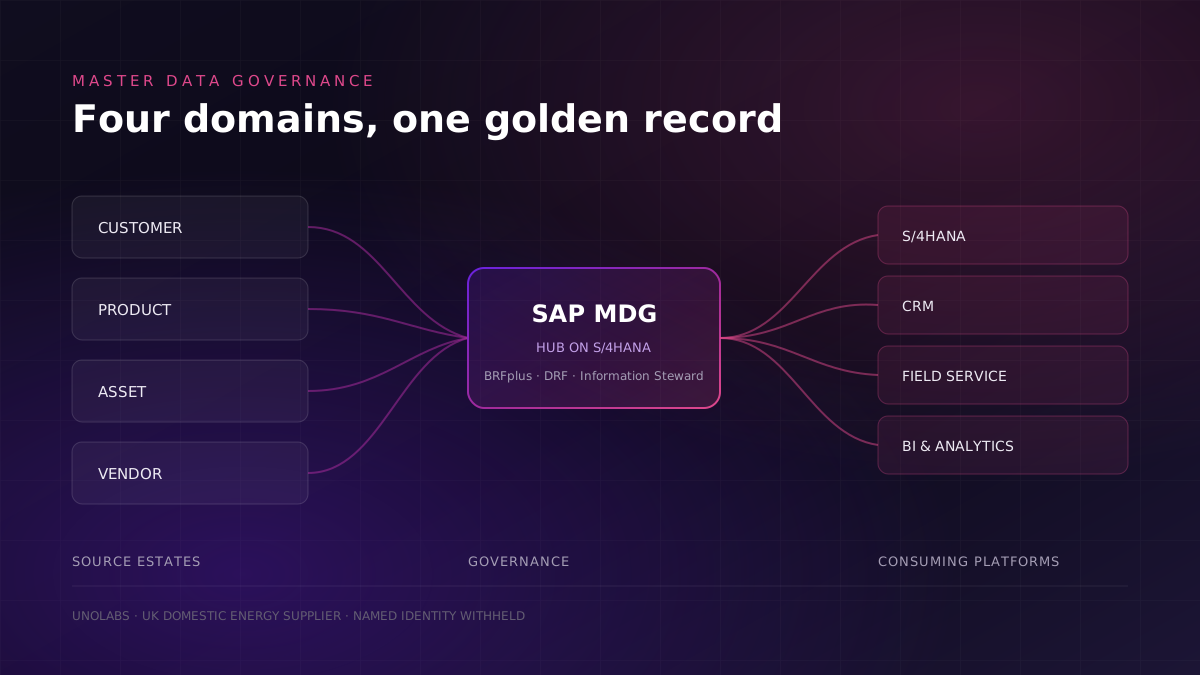
Centralised customer, product, and location records for a leading energy utility, collapsing duplicate records onto governed golden records through SAP MDG.
Read Technical ProofUtility Operational Intelligence Flow
Meters, SAP, OMS, GIS, billing, work orders
Customer, product, location, asset, meter, outage, billing, and field service signals enter from utility systems.
MDM and asset graph
Data is deduplicated, mastered, linked by location and asset hierarchy, and governed with lineage.
Outage, asset, regulatory intelligence
Models and marts support outage response, asset risk, customer impact, service quality, and compliance reporting.
Operations, field, regulatory, customer
Teams consume dashboards, alerts, regulatory reports, and operational workflows.
Diagnostic view of the Utility data stack
This blueprint details the specialised processing zones, control points, and delivery channels specific to the Utility landscape.
Expert insights for Utility
Enterprise migration and production operating model stories.
Industry Transformation Outcomes
Real-Time Grid Load Balancing
Unified Asset Intelligence
Resilient Energy Transition Infrastructure
How We Deliver in Utilities
For regulated grid operators, how a partner delivers matters as much as what gets built. This is the operating model we bring to utility engagements — from CIP-safe architecture through jointly measured outcomes to the commercial structures behind them.
Client Context We Operate In
Our utility clients are regulated transmission, distribution, generation, and retail operators — typically running estates from a few hundred thousand to several million AMI meters, with IT and OT managed by different organisations under different change regimes. NERC-CIP, or its regional equivalent, draws a hard boundary through the middle of every data initiative. The operational stack is almost always multi-vendor: one supplier's SCADA, another's ADMS and OMS, a GIS network model maintained separately, and an AMI head-end with its own MDM. All of it operates under regulator visibility — rate cases, reliability filings, and prudency reviews mean any number a data platform produces may eventually be defended in a proceeding. We design for that backdrop from day one.
Why These Engagements Are High-Risk
Utility data programmes carry risk profiles most industries never see. Analytics touching SCADA or ADMS sits adjacent to grid safety: a badly designed integration is an operational problem, not a data problem. Every new data path is potential CIP compliance exposure, which makes architecture decisions audit artefacts. Numbers feeding reliability filings or rate cases must be filing-grade — an error there is a regulatory event, not a bug. Delivery calendars bend around storm-season change freezes, when nothing near operations moves. And the timescales collide: assets are planned on twenty-year horizons while platform technology cycles run closer to twenty months, all alongside a unionised field workforce whose procedures cannot be casually re-engineered. We plan engagements around these constraints, not despite them.
Methodology, Frameworks & Accelerators
Every utility engagement opens assessment-led: we map the estate, the CIP boundary, and the reporting obligations before proposing architecture. Delivery follows a CIP-respecting reference architecture — one-way data paths out of the electronic security perimeter, no inbound connections — with domain models aligned to the IEC CIM so data products outlive vendor swaps. Three Unolabs accelerators compress the timeline: the Utilities Intelligence Accelerator brings pre-built outage, asset, and operational KPI domains; Migration Factory industrialises legacy estate moves with wave management and reconciliation controls; DQ Sentinel runs continuous quality observability inside the client environment. Execution is wave-based, and each wave closes through an evidence gate — reconciliation proof, security review, documented decisions — before the next begins.
Industry Insight Applied
Four practices shape most decisions we make. First, the as-operated network in SCADA and ADMS and the as-built network in GIS are reconciled, never merged — collapsing them into one model destroys the audit trail both sides depend on, so we maintain a governed mapping instead. Second, reliability analytics apply IEEE 1366 major-event-day exclusions from day one, so SAIDI and SAIFI trends reflect controllable performance rather than storm luck. Third, interval-data economics are decided at architecture time: read frequency multiplied by meter count sets the cost curve, so aggregation grain, storage tiering, and retention are settled before ingestion begins. Fourth, DER growth and FERC Order 2222 participation are design constraints now, so the platform is not rebuilt when distributed resources become dispatch-relevant.
How Benefits Are Measured
We do not claim outcomes; we instrument them. The assessment phase establishes baselines — jointly signed off with the client's finance and regulatory teams so nobody disputes the starting line later. Each delivery wave then tracks a utility-native KPI set: SAIDI, SAIFI, and CAIDI deltas computed with major-event-day exclusions applied consistently; load-forecast MAPE reported by feeder class rather than as a single flattering average; AMI data completeness and VEE pass rates; time-to-evidence for regulator and audit data requests; adoption of O&M analytics by planning and field teams; and platform cost per million meter reads. The measurement method, exclusion rules, and calculation logic are documented up front, so improvement claims are reproducible by the client — or by their regulator.
Collaboration & Capability Transfer
We deliver paired: Unolabs engineers work alongside client data and OT engineers from the first wave, not in a separate workstream handed over at the end. Runbooks and architecture decision records are standard artefacts of every wave — the reasoning behind each CIP boundary decision and model choice is written down while it is fresh. Data stewards and platform operators get structured enablement sessions tied to what just shipped. Handover is gated, not assumed: in the final wave, client teams run delivery with Unolabs shadowing, and exit criteria — defined at kickoff, not negotiated at the end — determine when we step back. The goal is a utility that operates its own platform.
Quality Assurance & Delivery Governance
Every wave passes QA gates before it ships: reconciliation evidence proving source and target agree, change management run in the spirit of CIP-010 baseline controls even for systems outside formal CIP scope, and a security review before any OT-adjacent data path goes live — no exceptions for schedule pressure. Programme governance runs on a steering cadence with a RAID log where every risk and issue has a named owner and a date. Outputs destined for filings or regulatory evidence get independent review by someone who did not build them. Cutovers are rehearsed with tested rollback paths, because in a utility the fallback plan is not optional documentation — it is the condition for proceeding.
Commercial Flexibility
We structure commercials to match how utilities buy. Entry points are fixed-scope: an assessment or blueprint sprint with a defined deliverable and price, so procurement can approve without open-ended exposure. Delivery waves are offered at fixed pricing per wave, scoped against the evidence gates described above. For clients who want alignment on results, we offer outcome-linked components tied to the jointly baselined KPIs — the same SAIDI/SAIFI, MAPE, and data-quality measures both sides signed. Accelerator-led delivery can be structured as shared risk, a model we already operate in other industries. Where a client's policy disfavours time-and-materials, we accommodate that. Whatever the shape, the commercial model is agreed before delivery starts — never renegotiated mid-wave.
Capability pillars behind the model
Data & AI Governance
CIM-aligned ownership and stewardship across meter-to-cash and grid domains, plus model governance for forecasting and outage AI — with lineage designed so any filed number traces back to the field device that produced it.
Platform Engineering & Operations
Utility lakehouse builds on Databricks, Azure, or Microsoft Fabric with DMZ landing zones provisioned as code, interval-scale partitioning strategies, and platform operations tuned for storm-event ingestion spikes and month-end settlement loads.
Data Engineering & BI
Pipelines that respect VEE status and versioned re-reads, feeding reliability, asset-health, and regulatory reporting marts — surfaced through Power BI and operational cockpits used by control rooms, planners, and compliance teams.
Data Science, AI & Machine Learning
Feeder-level load forecasting, storm-impact and outage prediction, vegetation and asset-risk scoring, and DER-aware demand models — built with the backtesting discipline and explainability that regulated operational decisions require, deployed against the governed grid model.
Capability Transfer
Paired build teams, steward and operator enablement tied to each release, and gated handover where client engineers run the final wave — so the utility's own people operate, extend, and defend the platform after exit.
Governance & Assurance
Wave-level QA gates, reconciliation evidence packs, CIP-aligned change control, independent review of filing-grade outputs, and a steering rhythm with owned RAID items — assurance practices shaped for programmes a regulator can inspect.
Commercial Flexibility
Fixed-scope assessments, wave-priced delivery, outcome-linked and shared-risk structures tied against jointly signed baselines, and accommodation of non-T&M procurement policies — with the full commercial model settled before any delivery work begins.
Engineering Utility Ecosystems
How our 2026 service catalogue integrates to solve high-growth industry challenges.
Utilities Intelligence Accelerator
Domains before dashboards
Stand up governed asset, outage and customer domains with reliability marts, so regulatory lineage is designed in, not assembled after.
“Control room, field and regulatory teams each describe the network differently, so board papers and regulatory submissions are reconciled by hand before every cycle.”
Governed KPI definitions
One agreed definition per reliability, service-quality and compliance measure, each with a named steward and drill-to-source lineage, so operations, the board and the regulator quote the same number.
An interval read can change days after it lands — estimated, re-read, then edited in billing review — so reads treated as immutable drift from billing.
Data Engineering & Integration
CIP-respecting data paths
Replicate OT signals outward only, so planning gains historian and meter data without an inbound path or a change to CIP asset scope.
“A funded analytics programme stalls at security review, because every route to the data inside the security perimeter arrives as a compliance question, not an engineering one.”
CIP boundary evidence pack
The outbound-only replication design, the security review behind it, and a written record that no inbound connection was created, no tooling sits on OT assets and CIP scope is unchanged.
Any change to CIP asset scope turns a modest integration into a compliance event, so the boundary decision governs the cost of everything built behind it.
Data Architecture
As-built vs as-operated
Reconcile GIS, SCADA and ADMS through a scoped CIM profile rather than a merge, so the audit trail each side depends on survives.
Enterprise Data Platform Engineering
Interval data economics
Settle grain, tiering and retention before ingestion — a million meters at 15-minute reads is roughly 96 million a day, held for years.
Enterprise Decision Intelligence & Operational Analytics
Reproducible SAIDI
Codify IEEE 1366 exclusions and versioned customer counts, so a filed reliability trend shows controllable performance rather than weather.
Enterprise Predictive Intelligence & Decision Forecasting
Warning time, then score
Set the lead time each event class needs before a model is built — a prediction after the decision window is indistinguishable from none.
Data Strategy & Governance
Four domains, one hub
Govern customer, product, asset and vendor as one programme, so a migration inherits agreed records rather than relocating the argument.
“A transformation is funded and dated, and the customer, asset and vendor records it will carry into S/4HANA still disagree across billing, CRM and field service.”
Golden record ownership map
Named owner, agreed definition and approval path for every record type across the four domains, including metering points whose regulated identity is set outside the business.
A hub can route, rule and replicate, but not decide what the business means by a customer; that stewardship is a standing cost, not a project line.
DevOps & SRE
CIP-010 change evidence
Make each release emit its own baseline, approval and verification record, so a CIP audit sample becomes a query, not a reconstruction.
Start Your Utility Modernisation
We'll review your current architecture, identify immediate bottlenecks, and draft a production-grade roadmap for your autonomous transformation.
"Bring last quarter's SAIDI numbers. We'll show you what the AMI data isn't telling you."