Data Infrastructure
Utility Asset Data and the Network Model: What UK Water and Energy Networks Need
How UK water and energy networks should structure asset registers, GIS connectivity, condition and work-order data into a network model regulators trust.
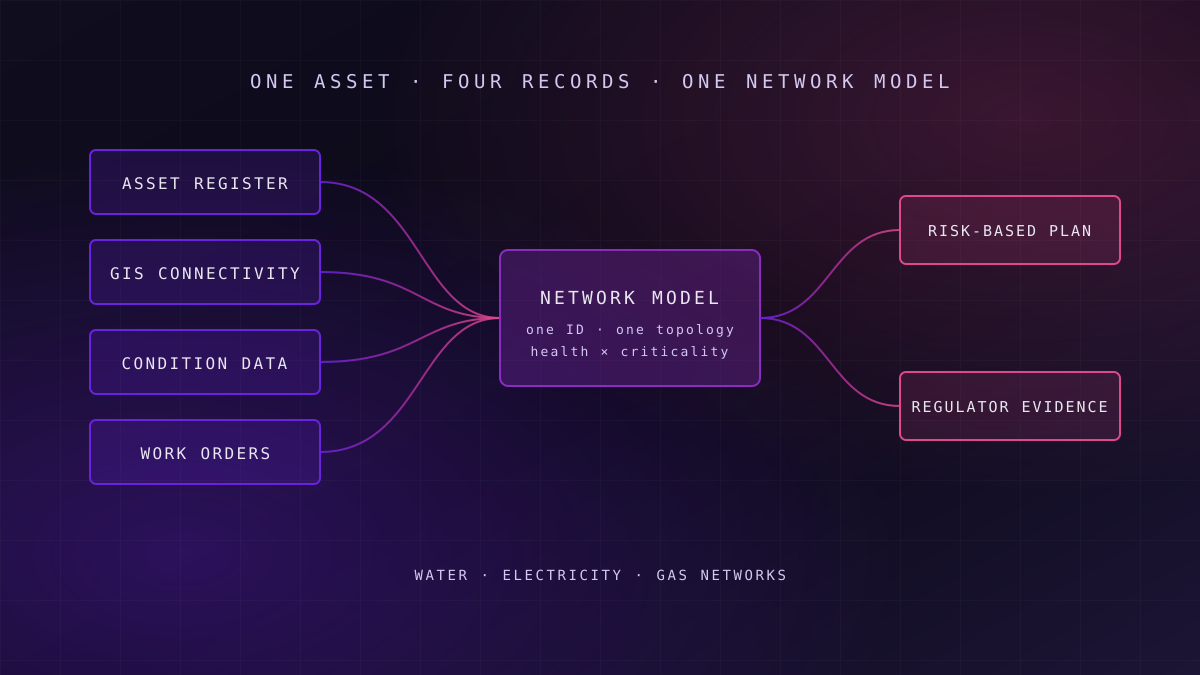
A utility network model joins four records that usually live apart: the asset register, GIS connectivity, condition data and work-order history. Joined under one asset identity and one topology, they let water and energy networks rank assets by health and criticality, justify investment to Ofwat or Ofgem, and support digital twins that are more than diagrams.
Every UK network company already holds this data. The problem is rarely absence; it is that each record was built for a different team, keyed differently and corrected at a different pace. This article covers how to bring them together, what the regulators' risk measures demand of the data, and when a targeted clean-up beats a platform programme.
Why Asset Data Became a Regulatory Problem
What this means for you: price controls now judge networks on asset risk and health, so asset data quality has moved from an engineering concern to a revenue one.
In electricity distribution, Ofgem's RIIO-ED2 price control, running from April 2023 to March 2028, holds network operators to Network Asset Risk Metric targets. Those targets are calculated with the Common Network Asset Indices Methodology, version 2.1, which Ofgem approved in April 2021. The methodology turns each asset's condition, age, environment and consequence of failure into a monetised risk value.
In water, Ofwat's PR24 final determinations, published in December 2024, set the 2025–30 price control. Asset health featured heavily in the debate around them, including in the redeterminations several companies sought from the Competition and Markets Authority, where funding for mains renewal and long-term asset health was a central argument.
A risk metric is only as defensible as the asset record it is calculated from.
Both regimes share a consequence. When a company argues for investment, or explains why a risk target was missed, it does so with numbers derived from asset data. If the register, the GIS and the condition records disagree, the argument is weaker than the engineering behind it.
The Four Records Behind Every Network Asset
What this means for you: most asset data problems are join problems, so start by naming the four records and who owns each.
- The asset register is the system of record for what exists: identity, type, specification, installation date and ownership. It usually lives in the enterprise asset management system, such as SAP Plant Maintenance or IBM Maximo.
- GIS connectivity records where each asset is and what it connects to: which main feeds which property, which transformer serves which feeder. It is the spatial and topological truth, and it is usually maintained by a separate team on a separate cycle.
- Condition and criticality data records the asset's health and what happens if it fails: inspection grades, test results, CCTV surveys for sewers, partial discharge readings for switchgear, plus the customers, roads or critical sites downstream.
- Work-order history records what was done to the asset and why: repairs, replacements, defects found and costs incurred. It is the evidence of how the asset actually behaves, as opposed to how it was expected to.
| Record | Usual system | Typical failure | What it costs you |
|---|---|---|---|
| Asset register | Enterprise asset management | Duplicates, retired assets still live, missing install dates | Age-based health scores built on guesses |
| GIS connectivity | GIS | Lags field changes, broken topology at boundaries | Wrong customers and consequences attached to failures |
| Condition and criticality | Inspection tools, spreadsheets, specialist systems | Patchy coverage, inconsistent grading scales | Risk ranked on the assets that happened to be inspected |
| Work-order history | Enterprise asset management, contractor systems | Free-text failure codes, work booked to the wrong asset | No reliable failure rates to calibrate models |
The Network Model: Where the Four Records Meet
What this means for you: the network model is the shared structure that every risk, planning and operational use reads from, so design it once and deliberately.
Electricity: IEC CIM
For power networks, the Common Information Model is the established vocabulary. IEC 61970 covers transmission and energy management, and IEC 61968 covers distribution management. Together they define classes for equipment, connectivity, assets and work that let systems exchange network data without bespoke mappings for every pair.
The practical lesson is to implement a scoped profile, not the whole standard. Pick the classes your asset, outage and planning domains actually need, document extensions explicitly, and treat the profile as a contract between systems. Adopting the full model wholesale tends to produce a long modelling exercise and little in production.
Water: Connectivity Without a Single Standard
Water networks have no equivalent single standard. Most companies hold connectivity in GIS and in hydraulic models built for network analysis, and the two drift apart. The network model has to reconcile them, decide which is authoritative for which purpose, and record the decision so that a burst on one main resolves to the same customers in every report.
Key idea
One asset, one identifier, everywhere
The single most valuable design decision is a persistent asset identifier shared by the register, GIS, condition and work-order systems. Without it, every join is a fuzzy match, and every risk number carries an unstated error.
The model itself can live in a relational design, a knowledge graph or a lakehouse with graph views. The storage choice matters less than the rules: one identity, versioned connectivity, and explicit ownership of each attribute. These are the same principles set out in our approach to governed enterprise data architecture.
Who Owns Each Attribute
What this means for you: a network model without named attribute owners decays back into four disagreeing records within a year.
Asset data crosses team boundaries by nature. Asset management owns the register, a GIS team owns connectivity, field operations generate condition and work data, and contractors often record the work itself. Each team is accountable for its own system, but nobody is accountable for the asset as a whole, which is exactly where the inconsistencies accumulate.
The fix is attribute-level ownership. For each attribute that feeds the risk model, name the system of record, the team that maintains it and the process by which a correction reaches it. Install date belongs to the register; connectivity belongs to GIS; condition grade belongs to the inspection process; failure code belongs to whoever closes the work order. Where two systems both hold an attribute, one is authoritative and the other is a copy, and the model records which.
| Attribute | System of record | Correction route | Signal it is drifting |
|---|---|---|---|
| Install date and material | Asset register | Asset data steward, evidenced by records or survey | Rising share of inferred values |
| Connectivity | GIS | Field change notice to GIS editors | Mismatch with operational or meter evidence |
| Condition grade | Inspection process | Inspector, within the grading standard | Coverage falling below the agreed cycle |
| Failure code | Work-order closure | Supervisor review at closure | Free-text codes and parent-asset bookings |
Contractors deserve particular attention. Much of the field data in UK networks is captured by delivery partners, and contract terms rarely specify asset identifiers, failure codes or condition grades to a standard the model can use. Writing the data standard into the contract is cheaper than cleaning the data afterwards.
Health and Criticality: Turning Records Into Risk
What this means for you: a risk score is a calculation over data, so its weakest input sets its credibility.
Risk-based investment ranks assets by probability of failure multiplied by consequence of failure. Probability comes from condition, age, environment and failure history. Consequence comes from connectivity and criticality: how many customers, which critical sites, what environmental or safety exposure.
Each input maps to one of the four records, which is why disconnected records produce unstable rankings. If install dates are missing, age defaults distort health. If GIS connectivity lags the field, consequence is attached to the wrong customers. If work orders are booked to a parent asset rather than the failed component, failure rates are diluted across assets that never failed.
Failure mode
Failure mode: inspecting your way into a biased plan
When condition data exists only for assets that were inspected recently, the risk model concentrates investment on them. Uninspected assets look healthy because nothing says otherwise. Track inspection coverage as a data quality measure, not just inspection results.
The fix is to measure the inputs, not just the outputs. Treat completeness of install dates, connectivity confidence and condition coverage as tracked data quality SLOs, owned by named people and reported alongside the risk results. That is the discipline behind continuous data quality monitoring and governance, applied to assets rather than customers or transactions.
Data Quality for Risk-Based Investment
What this means for you: fix the data defects that move investment decisions first; leave cosmetic ones for later.
Not every defect matters equally. A misspelt street name rarely changes a ranking. A missing pipe material or a wrong installation decade often does. The useful exercise is a sensitivity test: perturb each input and see which defects move assets across the investment threshold.
Identity
Duplicate and orphan assets, mismatched identifiers between register and GIS. Fix first, because every other join depends on it.
Attributes that drive health
Material, diameter, install date, rating. Infer carefully where missing, and flag every inferred value so it is never mistaken for a record.
Connectivity
Topology breaks at boundaries and stale GIS edits. Reconcile against field and operational evidence, and version every correction.
Failure history
Work orders booked to the right asset with a structured failure code. Without this, failure rates cannot calibrate the health model.
Inferred values deserve particular care. Filling a missing install date from neighbouring assets is often reasonable, but the inference must be flagged and carried through every calculation, so a regulator query can be answered honestly. Lineage from record to risk value, the data lineage that shows which inputs were measured and which were estimated, is what makes the number defensible. Practical monitoring patterns for catching these defects early are covered in our guide to data observability and quality management.
Digital Twins, Realistically
What this means for you: a digital twin is worth building only after the network model it depends on is trustworthy.
A digital twin of a network is the network model kept current with operational data, so that it can be queried and simulated. In practice the twin is only as good as the asset identity, connectivity and condition data beneath it. Visualisation layers built over unreconciled records produce convincing pictures of the wrong network.
The useful sequence is model first, then live feeds, then simulation. Telemetry and meter data add a great deal once they attach to the right assets: smart meter data, for example, can flag where mapped connectivity disagrees with observed demand, a use covered in our article on smart meter data platforms. Keeping the model current as source systems change is usually a change data capture problem rather than a nightly reload.
A twin built on an unreconciled network is a detailed drawing of the wrong network.
When a Simpler Asset Data Clean-Up Is the Better Choice
What this means for you: a platform programme is not the default answer, and for many networks it is the wrong first step.
A full network model platform earns its cost when several teams need the same joined data continuously: investment planning, operations, regulatory reporting and analytics. Where the immediate need is narrower, such as defending one asset class in a business plan or fixing one reporting return, a targeted clean-up is faster and cheaper.
The clean-up still needs discipline: one asset class, the four records reconciled, defects logged with owners, and the corrections written back to the source systems rather than held in a spreadsheet. Fixing data only in a downstream copy is the most common way these efforts are lost by the next submission.
Readiness signal
Readiness signal: can one asset class be traced end to end?
Pick one class, such as distribution transformers or trunk mains. If you can trace every asset from register to GIS, condition and work orders with one identifier, you are ready to scale. If you cannot, start there.
A platform programme is also the wrong call where the enterprise asset management or GIS system is about to be replaced. Reconcile the data into the new system's model as part of the migration, using a repeatable migration and reconciliation approach, rather than building a separate model that the replacement will strand. Where an industry starting point helps, a pre-built utility template can shorten the design work; the trade-offs are set out in our comparison of reference architectures and industry data templates.
Where to Start
What this means for you: a short, evidence-led first phase will tell you whether you need a clean-up or a platform.
- Pick one high-value asset class that matters in your current price control and where the risk numbers are contested.
- Trace the four records for that class and measure identity matches, attribute completeness, connectivity confidence and failure-code quality.
- Run a sensitivity test on the risk model to find which defects actually move investment decisions.
- Fix at source with named owners, and flag every inferred value.
- Decide the architecture on evidence: if several teams need the joined data continuously, design the network model as a shared data product; if not, keep the clean-up scoped and repeat it for the next class.
Scope matters here: a first asset class can usually be reconciled in weeks rather than quarters, while bringing the whole estate into one network model is multi-year work aligned to price control cycles. Our utility industry templates exist for the second case, not as a substitute for the first.
Frequently Asked Questions
What is a utility network model?
A utility network model is the joined representation of a water or energy network: every asset with a persistent identifier, its connectivity to other assets and customers, its condition and criticality, and its work history. It is the shared structure that investment planning, regulatory reporting, operations and digital twins read from, so that each team works from the same view of the network.
What is CNAIM and why does asset data matter for it?
The Common Network Asset Indices Methodology is the approach Ofgem uses with electricity distribution operators to measure asset health, criticality and monetised risk, and RIIO-ED2 targets are set against it. Its calculations depend on asset attributes, condition and consequence data, so gaps or errors in asset records feed directly into the risk values a company reports and is assessed against.
Do water companies need IEC CIM?
IEC CIM was designed for power networks, through IEC 61970 and IEC 61968, and is not the standard for water. Water companies usually reconcile GIS connectivity with hydraulic network models instead. The underlying principles still apply: a persistent asset identifier, versioned connectivity, explicit ownership of each attribute and a documented model that every system maps to.
Is a digital twin worth it for a network company?
A digital twin pays back when the network model beneath it is trustworthy and several teams use it for decisions, such as outage planning, investment prioritisation or network simulation. Built over unreconciled asset data, a twin produces convincing visualisations of an inaccurate network. Reconciling identity, connectivity and condition data first is what makes a twin useful.
How long does an asset data clean-up take?
A focused clean-up of one asset class, reconciling the register, GIS, condition and work-order records, typically takes weeks rather than quarters. Extending the same approach across the whole estate, or building a shared network model platform, is multi-year work usually aligned to price control cycles. Starting with one contested asset class gives evidence for the larger decision.
Unolabs is a Data and AI first engineering consultancy, headquartered in the United Kingdom with engineering operations in Pune and active engagements across the UK, Australia, and Hong Kong. We help enterprises build the architectural foundation for autonomous AI execution — governed data platforms, semantic intelligence, and agentic systems that enterprises can stand behind.
If you are weighing how to bring asset registers, GIS and condition data into one network model, book a discovery call and we will work through it with you.
More Where
This Came From.
New architectural deep-dives land every two weeks. Pick your channels and we will send them as they publish.
Continue reading
- Data InfrastructureData Mesh vs. Fabric: Selecting the Right Architecture for 2026Data mesh versus data fabric across ten dimensions: what each one fixes, how each one fails, and a decision framework for choosing or combining them.15 min read
- Data InfrastructureLakehouse Performance Tuning: Optimising Multi-Petabyte Databricks EnvironmentsBeyond Z-Order and Liquid Clustering: how to tune a multi-petabyte Databricks lakehouse in the order that pays — layout, then skipping, then compute.15 min read
- Data InfrastructureKafka-to-Lakehouse Streaming Patterns for Global ScaleImplementation patterns for Kafka-to-lakehouse pipelines: exactly-once ingestion, schema evolution, stream processing, and millisecond serving.14 min read
Find where your asset data breaks the risk model
We will trace one asset class from register to GIS, condition and work orders, and show you which gaps distort health, criticality and the investment case.
Book an Asset Data Review