Industry Data Strategy
Revenue Growth Management Analytics in CPG: The Data Foundations It Needs
What revenue growth management analytics in CPG needs: price-pack data, promotion effectiveness, EPOS and syndicated feeds, and trade spend finance trusts.
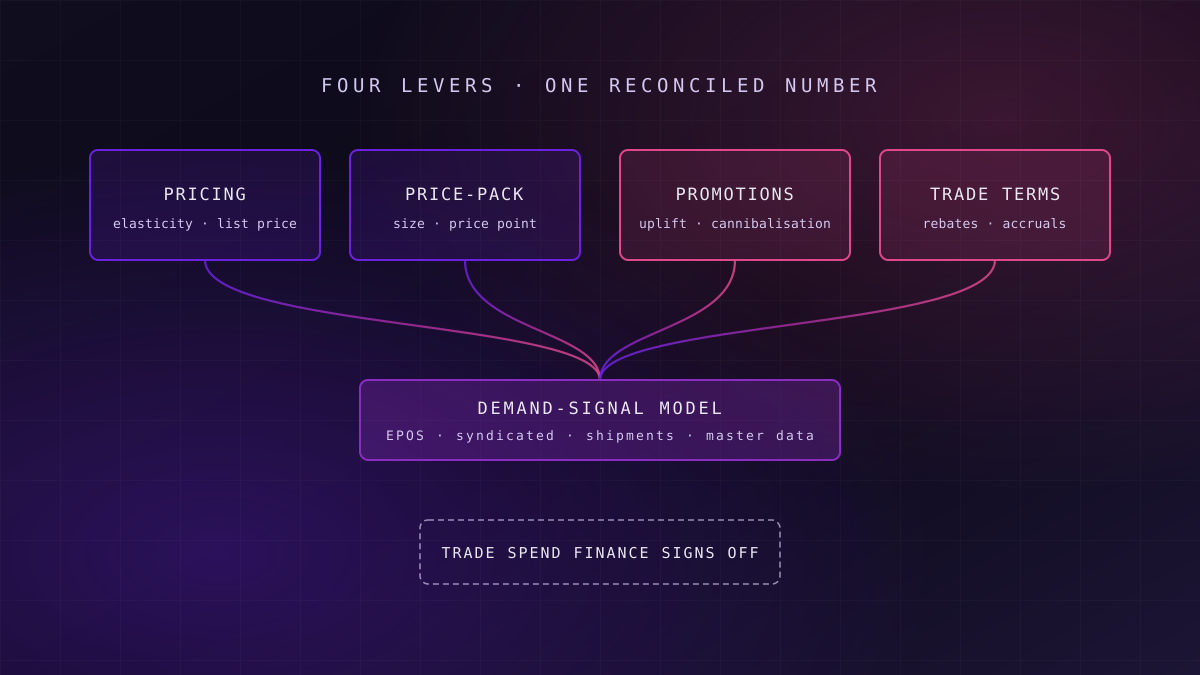
Revenue growth management analytics needs four things before any model: product and customer master data that match retailer hierarchies, promotion and trade-spend records that reconcile to finance, sell-out data from retailer EPOS or syndicated sources joined to shipments, and agreed definitions of uplift and baseline. Without them, RGM produces confident numbers that commercial and finance teams dispute.
Revenue growth management (RGM) is the discipline in consumer packaged goods of growing profitable revenue through four levers: pricing, price-pack architecture, promotions and trade terms with retailers. Most CPG manufacturers have an RGM team. Far fewer have the data underneath it that lets those levers be judged on evidence rather than on the loudest argument in the annual planning meeting.
This article is about that data. It sets out what each lever needs, where machine learning genuinely helps, where it misleads, and when a spreadsheet-led approach is still the sensible choice.
Why Revenue Growth Management Has Become a Data Problem
What this means for you: the commercial questions RGM asks have not changed, but the volume of money at stake and the scrutiny on it have, and both expose weak data.
Trade spend is the largest line most CPG manufacturers never fully see. It covers temporary price reductions, multibuys, feature and display fees, listing fees, rebates and off-invoice discounts, and it is agreed across hundreds of retailer negotiations a year. Much of it is accrued in finance before anyone knows what it delivered.
The evidence on its effectiveness is not flattering. A Nielsen analysis of 39 million promotional events across 150 US retail banners, reported by FoodNavigator in October 2014, found that almost three-quarters of CPG promotions failed to break even. The figure is US-only and dated, but the pattern it describes is one most commercial directors recognise in their own numbers.
Most promotions are judged on the volume they move, and paid for in the margin nobody measured.
Regulation has also changed what promotions are possible. In England, restrictions on volume price promotions for less healthy food and drink, such as multibuys and "buy one get one free", took effect on 1 October 2025 for businesses with 50 or more employees, according to GOV.UK implementation guidance. In the UK grocery trade, the Groceries Supply Code of Practice, in force since February 2010, governs how the largest retailers can ask suppliers to fund promotions. Both make the record of what was agreed, and what it cost, a matter of compliance as well as performance.
What RGM Analytics Actually Covers
What this means for you: RGM is four related decisions, each with a different data need, and treating them as one dashboard is the commonest design mistake.
Pricing sets list and shelf prices by product, channel and retailer, using estimates of price elasticity: how much volume changes when price changes. Price-pack architecture decides which pack sizes exist at which price points, so that each shopper mission and price tier is covered without packs cannibalising each other.
Promotion effectiveness measures what each promotion delivered against a baseline: the incremental volume, the volume pulled forward from future weeks, the volume taken from the brand's own other products, and the margin left at the end. Trade terms govern the annual agreements with retailers: rebates, conditional payments and fixed fees, and whether they are earning what they cost.
| Lever | Core question | Data it needs first | Choose this as the starting point when |
|---|---|---|---|
| Pricing | What price maximises profit without losing distribution? | Clean weekly sell-out by product and retailer, price history, cost to serve | List prices have not been reviewed in two or more cycles |
| Price-pack architecture | Which packs and price points should exist? | Product attributes, pack-level sell-out, shopper or panel data | Range has grown by accretion and nobody can explain every pack |
| Promotion effectiveness | Which promotions made money? | Promotion calendar matched to sell-out, agreed baseline method, funding records | Promotions take a large share of volume and nobody agrees which work |
| Trade terms | Are retailer agreements earning their cost? | Contract terms, accruals and settlements reconciled to finance | Trade spend is growing faster than net revenue |
The starting lever should be the one where the money is largest and the data is closest to ready, which is rarely the one with the most impressive model.
The Data Foundations Under Every Lever
What this means for you: if these foundations are missing, every RGM output will be argued about, and the argument will be about data rather than strategy.
Master Data That Matches the Way Retailers Sell
RGM depends on two hierarchies agreeing: the product hierarchy (brand, sub-brand, pack, variant) and the customer hierarchy (retailer group, banner, format, store). Manufacturers often hold three versions of each: one in the ERP, one in the trade promotion management tool and one in the syndicated data feed. Every mismatch becomes a line in a reconciliation spreadsheet.
Failure mode
Failure mode: three product hierarchies, three answers
When a promotion's uplift is calculated on the syndicated hierarchy and its cost on the ERP hierarchy, the two never join cleanly. The result is an ROI figure that commercial and finance teams compute differently and neither will sign.
Sell-Out Data: EPOS and Syndicated Sources
Shipments, or sell-in, tell you what left the factory. They do not tell you what shoppers bought, when, or at what price. For that, manufacturers rely on retailer EPOS (electronic point-of-sale) data shared through retailer portals, and on syndicated retail measurement and consumer panel data from providers such as NielsenIQ and Circana, the company formed when IRI and The NPD Group merged and adopted the Circana name in March 2023.
Each source has a different grain, coverage and delay. EPOS data is detailed but limited to retailers who share it. Syndicated data covers the market but arrives later and in its own hierarchy. The demand-signal model has to reconcile them with shipments, which is the "which sales number is true" argument our piece on reference architectures and industry data templates describes for consumer goods.
Promotion and Trade-Spend Records
The single most valuable dataset in RGM is a promotion calendar in which every event carries its mechanic, dates, retailer, products, agreed funding and actual settlement. Most manufacturers have the plan and the invoice, and very little that links them at event level.
Event identity
Every promotion has one identifier carried from plan through execution to settlement, so its cost and its uplift can be joined.
Agreed baseline
One documented method for expected sales without the promotion, applied consistently, so uplift means the same thing in every report.
Reconciled funding
Accruals, deductions and settlements tied back to events and agreed with finance, so the ROI denominator is not an estimate.
These are data products with owners, and they belong on a governed enterprise data architecture rather than in the trade promotion tool alone.
The Demand-Signal Model
What this means for you: the demand-signal model is the shared layer every RGM decision reads from, and it is where most of the build effort should go.
A demand-signal model joins sell-out, sell-in, promotions, prices, distribution and external factors such as seasonality and weather at a consistent weekly grain by product and retailer. It is not a forecast. It is the governed history from which forecasts, elasticities and promotion evaluations are all estimated.
Its definitions matter as much as its data. Baseline, uplift, incremental margin, cannibalisation and forward buying each need one agreed calculation, held in a semantic layer that defines each metric once so that the commercial dashboard and the finance pack cannot drift apart.
Key idea
Define uplift before you model it
If two teams calculate the baseline differently, a better model only produces a more precise disagreement. Agree and publish the baseline method first; model it second.
For manufacturers starting from scratch, a consumer goods data template can supply most of this shape, and our CPG intelligence accelerator is built around exactly these domains. The retailer's view of the same transactions is covered separately in our account of the retail analytics use cases that pay back.
Where Machine Learning Helps, and Where It Misleads
What this means for you: machine learning earns its place in RGM on a few well-bounded estimates, and becomes dangerous when it is asked to stand in for missing data or missing judgement.
Where It Helps
Machine learning is well suited to estimating promotional uplift across thousands of events, where it can account for mechanic, depth, display, season and competitor activity together. It also helps with price elasticity at product and retailer level, provided there is enough price variation in the history, and with detecting cannibalisation between packs. These are the estimates where predictive models built for production repay their cost.
Where It Misleads
Elasticity models fail quietly when price has barely moved: a product that has sat at one shelf price for three years carries almost no information about how shoppers would respond to a change. Uplift models inherit every error in the baseline and in the promotion calendar, and they cannot distinguish a promotion that worked from one whose funding was booked to the wrong event.
A model trained on a promotion calendar nobody trusts learns the calendar's errors with great confidence.
Optimisers are the sharpest risk. A promotion optimiser that recommends a plan without the retailer's constraints, the regulatory limits on less healthy products, or the capacity of the supply chain will produce plans that cannot be executed. Models also drift as shopper behaviour changes, so they need the monitoring and retraining discipline described in our guide to keeping predictive models running in production.
Readiness signal
Readiness signal: can you explain one promotion end to end?
Pick last quarter's largest promotion. If you can trace its agreed funding, actual settlement, sell-out uplift and margin from source data in an afternoon, the foundations are ready for modelling. If it takes a week of emails, they are not.
Governing the Trade-Spend Number
What this means for you: trade spend is a finance number before it is an analytics number, and RGM only gains authority when finance signs it.
The fastest way to lose an RGM programme is to publish promotion ROI that finance does not recognise. Trade-spend figures need an owner in finance, a documented path from accrual to settlement, and lineage from each dashboard figure back to its source, so that any number can be challenged and defended. The data lineage matters more here than in most analytics, because the figures shape negotiations worth millions.
Strategy&'s 2017 work on zero-based trade found that early efforts raised the return on CPG trade spending by 10 to 20 percent. The mechanism it describes is governance as much as analytics: justifying each element of trade spend from zero each cycle, rather than rolling last year's terms forward.
Data quality controls belong on the inputs that move money: missing event identifiers, settlements without a matching event, and hierarchy mismatches between sources. Monitoring them continuously, as automated data quality operations do, catches the errors before they reach a retailer negotiation.
When a Spreadsheet-Led RGM Approach Is Still Right
What this means for you: a governed platform is not always the right first step, and building one too early can slow the commercial team down.
A spreadsheet-led approach, with good analysts and a disciplined promotion post-evaluation process, is often right for a manufacturer with a small number of retail customers, a narrow range and limited promotional activity. The value at stake may not justify a platform, and the analysts' judgement about a handful of retailer relationships is worth more than a model.
It is also right while the foundations are being fixed. Building an elasticity model before the product hierarchies agree produces outputs that will be rejected, and that rejection damages the case for the platform when it is ready.
The point to move beyond spreadsheets comes when post-evaluations cannot keep pace with the promotion calendar, when two teams regularly produce different ROI figures for the same event, or when trade spend grows faster than net revenue without anyone being able to say why. Those signals mean the cost of weak data has overtaken the cost of fixing it.
Where to Start: A Twelve-Week Foundation
What this means for you: a short, scoped foundation on one category and its top retailers proves the data before any model is built.
Start with one category and the retailers that make up most of its sales. In the first four weeks, align the product and customer hierarchies across ERP, trade promotion and syndicated sources for that scope, and agree the baseline and uplift definitions with commercial and finance.
In weeks five to eight, build the promotion event record for the last two years, joining plan, execution, sell-out and settlement, and measure how many events reconcile fully. In weeks nine to twelve, run a post-evaluation of every promotion in scope and present the results to commercial and finance together.
That is twelve weeks for one category's foundation and first evaluation, not for an RGM programme. Extending it across categories, and adding elasticity and optimisation models, is the multi-quarter work, and it belongs in a roadmap sequenced around decisions rather than tools. The reports themselves can then sit in whichever BI tool the business already uses; our comparison of enterprise BI platforms covers that choice.
Frequently Asked Questions
What is revenue growth management in CPG?
Revenue growth management is the discipline in consumer packaged goods of growing profitable revenue through four levers: pricing, price-pack architecture, promotions and trade terms with retailers. It relies on data that links each lever's cost to its effect on sell-out and margin, so that commercial teams can decide on evidence which prices, packs, promotions and retailer agreements to keep, change or stop.
What data does RGM analytics need?
RGM analytics needs product and customer master data that match retailer hierarchies, sell-out data from retailer EPOS or syndicated providers joined to shipments, and a promotion record that links each event's plan, execution and settlement. It also needs agreed definitions of baseline and uplift, and trade-spend figures reconciled with finance, so every return-on-investment figure can be defended.
Can machine learning optimise trade promotions?
Machine learning can estimate promotional uplift, price elasticity and cannibalisation across many events, provided the promotion calendar and baselines are reliable. It misleads when price history has little variation or event data is incomplete. Optimisers need retailer constraints, regulatory limits and supply capacity built in; otherwise they recommend promotion plans that cannot actually be executed.
Why do promotion ROI figures differ between teams?
Promotion ROI usually differs because teams use different baselines, different product or customer hierarchies, or different cost figures. Commercial teams often take planned funding while finance uses actual settlements. The remedy is one agreed baseline method, one hierarchy mapping across sources, and trade-spend figures owned and signed off by finance before they appear in commercial reporting.
When is a spreadsheet good enough for RGM?
A spreadsheet-led approach is good enough for a manufacturer with few retail customers, a narrow range and limited promotional activity, where skilled analysts can evaluate every event. It stops being adequate when evaluations fall behind the promotion calendar, when teams regularly disagree on the same event's return, or when trade spend grows faster than net revenue.
Unolabs is a Data and AI first engineering consultancy, headquartered in the United Kingdom with engineering operations in Pune and active engagements across the UK, Australia, and Hong Kong. We help enterprises build the architectural foundation for autonomous AI execution — governed data platforms, semantic intelligence, and agentic systems that enterprises can stand behind.
If you are weighing how to put revenue growth management on data your commercial and finance teams both trust, book a discovery call and we will work through it with you.
More Where
This Came From.
New architectural deep-dives land every two weeks. Pick your channels and we will send them as they publish.
Continue reading
- AI Readiness & StrategyThe Agent Tax: Why Replacing Your RPA Bots with AI Agents Could Blow Up Your Automation BudgetSwapping RPA bots for AI agents turns a fixed automation cost into one that scales with volume. The four cost lines most business cases leave out.15 min read
- Agentic ArchitecturesDesigning Production Agentic AI Systems: Architecture Patterns, Guardrails, and EvaluationHow production agentic AI is built: the agent loop, typed tool contracts, guardrail config, evaluation harnesses, and the gates that grant autonomy safely.18 min read
- AI Readiness & StrategyAgentic AI Is the Easy Part. Trusting It to Act Is the Hard Part.Agentic AI capability is now commodity. The authority to act is not. What a named owner signs for before an agent commits the organisation to something.14 min read
Find out which RGM numbers your teams can trust
We will trace your trade-spend, promotion and price-pack figures from source to dashboard and show which ones reconcile, which are contested and which nobody owns.
Book an RGM Data Review